SIDDHARTINO — kaonic helium 4 measurement
The SIDDHARTINO experiment collected about 20 days of data at the DAΦNE e+e– collider, in Frascati, during June 2021. A first set of data was collected with the SIDDHARTINO target cell filled with 4He gas at a temperature of 25 K and pressure of 1 bar, which corresponds to 1.5% of Liquid Helium Density (LHeD). This period of data taking was suited for the optimization of the degrader, in order to get a larger number of kaon stopped within the target cell. The information collected have been used in the SIDDHARTA-2 experiment. A second set of data was dedicated to the measurement of K––4He (3d → 2p) transitions at lower density, namely 0.4 bar, corresponding to 0.73% LHeD. The final analysis was performed on the summed spectra of 16.5 pb−1 and 9.5 pb−1 for the 1.5% and 0.73% LHeD runs, respectively, for a total integrated luminosity of 26 pb−1 collected in about 20 days of data-taking with the SIDDHARTINO apparatus [1,2].
1. Energy shift ($\varepsilon$) and width ($\Gamma$) measurement in gaseous K––4He
The complete spectrum of the data collected during the SIDDHARTINO experiment is shown in the figure below. The SDD detectors were calibrated using the method described in this page.
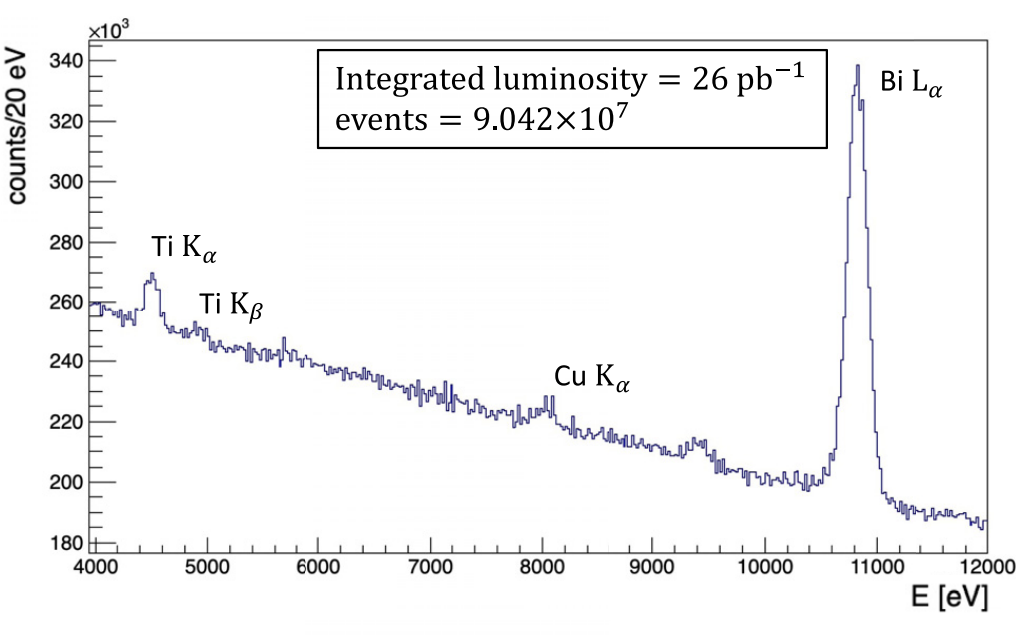
A strong data selection was applied to the spectrum data, using the kaon trigger system, which provided a rejection factor ≅ 105 [3], and the VETO systems. The final spectrum got with the SIDDHARTINO data selection is shown below.
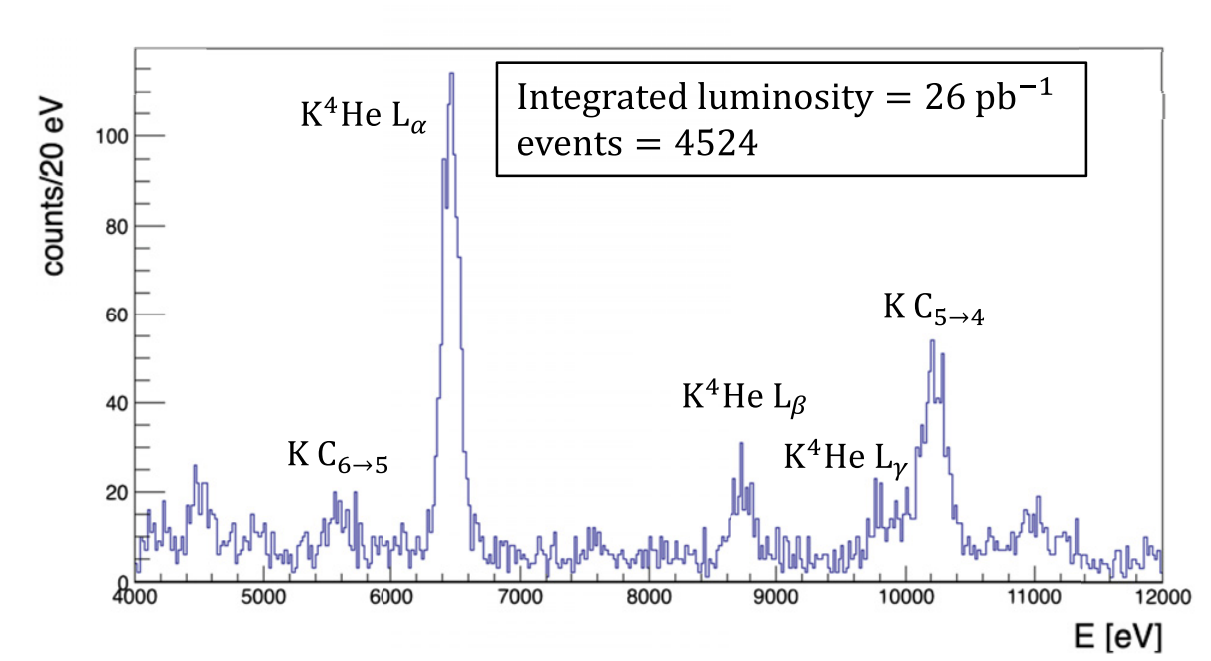
In the SIDDHARTINO final spectrum (shown above), the K4He Lα line (3d → 2p) is visible together with the Lβ (4d → 2p) and Lγ (5d → 2p) ones. Other lines correspond to kaonic carbon (KC), kaonic nitrogen (KN), and kaonic oxygen (KO) high-n transitions generated by kaons stopped in the target window made of kapton (C22H10O5N2), and to kaonic titanium (KTi) and kaonic aluminium (KAl) produced by kaons stopped in other elements of the experimental apparatus.
The K4He peaks were fitted with a Voigt function [4], the Gaussian part of which reproduces the detector energy response function, while the Lorentzian one describes the intrinsic line width of the transition. From the calibration procedure of the SDDs, it was found that the exponential low energy tails account for less than 1% of the peak amplitude, and hence are negligible for the kaonic helium peaks [5]. The other peaks were fitted using only the gaussian part since the shift and broadening due to the strong interaction are known to be negligible for n<2 levels [6,7].
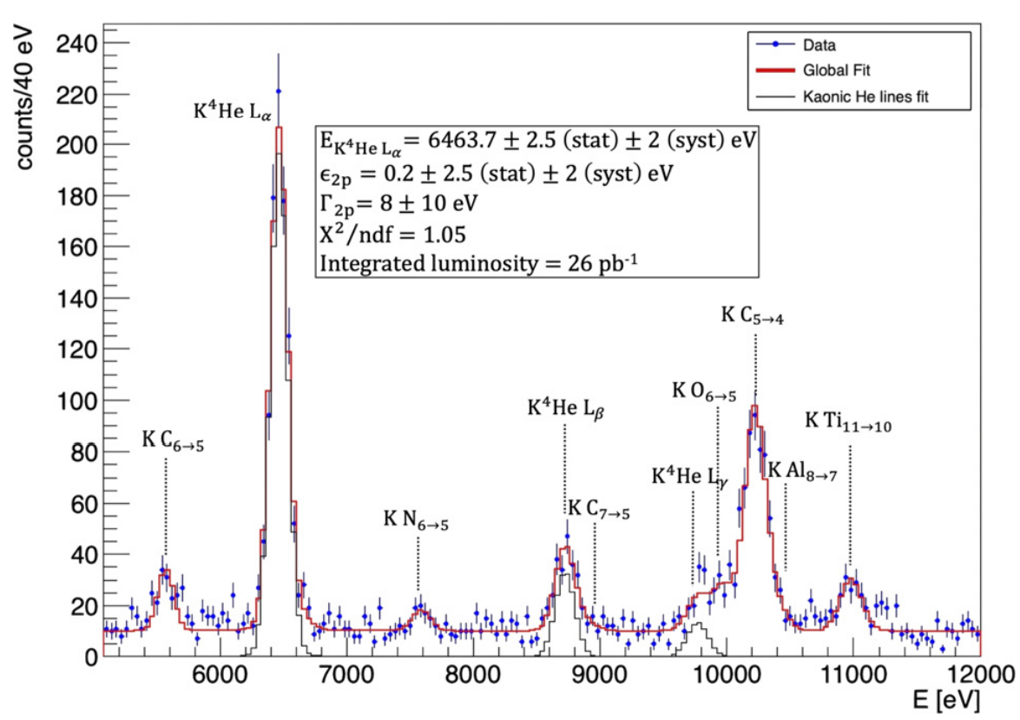
The difference between the purely electromagnetic calculated transition energies and the experimental ones, representing the strong interaction induced shift, can be then set as a common parameter to all the K4He peaks. Similarly to the shift parameter, also the strong interaction induced broadening of the 2p level, representing the Lorentzian contribution to the Voigt function, can be set as a common parameter to all the K4He lines. From the results of the fit the strong interaction induced shift and width of the 2p level was measured to be:
$\varepsilon _{2p}=E_{exp}-E_{e.m.}=0.2 \pm 2.5(stat) \pm 2.0(syst) \; eV$
$\Gamma _{2p}=8 \pm 10(stat) \; eV $
The systematic errors on the shift value were evaluated from the linearity and the stability of the energy response of the SDDs; other possible contributions (e.g. kaon timing window selection, different background contributions to the fit function) are negligible. The systematic errors on the width are negligible (less than 0.1 eV).
These results represent the most precise measurement of gaseous K4He (3d→2p) transition and confirm the experimental observations performed by the E570 [6] and the SIDDHARTA [4] experiments. More derails on this measurement can be found in [1].
2. Measurement L-series X-rays yields in gaseous K––4He
The absolute yield Y of the Lα X-ray transition for the K4He is then given by:
$Y=\dfrac{\varepsilon ^{EXP}}{\varepsilon ^{MC}}=\dfrac{N ^{EXP} _{X-rays} \cdot N ^{EXP} _{Ktrig}}{N ^{MC} _{X-rays} \cdot N ^{MC} _{Ktrig}}$
where $\varepsilon ^{EXP}$ and $\varepsilon ^{MC}$ are the experimental and Monte Carlo (MC) simulated x-rays detection efficiency, respectively, whilst $N ^{EXP} _{X-rays}$, $N ^{EXP} _{Ktrig}$, $N ^{MC} _{X-rays}$ and $N ^{MC} _{Ktrig}$ are numbers of detected X-rays and number of triggered events, respectively, extracted from the experimental measurement (EXP) and through the MC simulation.
The number of kaon trigger events $N_{Ktrig}$ was determined identifying the coincidence of a pair of kaons in both top and bottom scintillators of the kaon trigger. The timing information was used to separate the kaons from Minimum Ionizing Particles (MIPs). The time-of-flight difference and the timing resolution allow to identify the kaons with less than 1% contamination from the MIPs. More details on the data analysis are discussed in a separate paper [1].
The absolute yields were extracted using 33 of the 64 SDDs used in the SIDDHARTINo experiment, which were operating stably with good energy resolution (157.0 (stat) ± 0.4 (syst) eV (FWHM) at 6.4 keV). The final results is extracted using two sets of data:
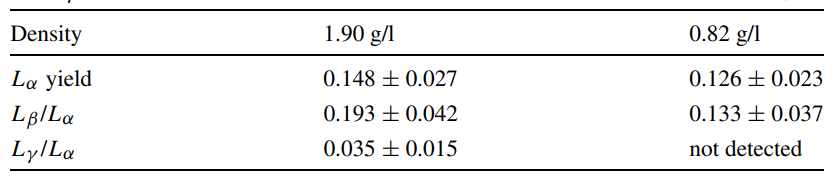
(a). A set of 70 hours of data acquired with 0.82 g/l 4He gas target density measurement for a total of 4.3 pb−1 integrated luminosity;
(b). A set of 125 hours of data acquired with 1.90 g/l 4He gas target density measurement for a total of 9.5 pb−1 integrated luminosity;
To fit each energy spectrum, the Lα, Lβ, and Lγ lines of kaonic helium-4, each represented by a Gaussian function, were included. The strong interaction width of the 2p level was set to zero in this analysis, since the strong interaction broadening is negligible [1]. A common parameter for the energy shift for the 2p state was introduced for all the three transitions. The intensities of the Lβ and Lγ transitions are given as ratios to the Lα transition. The background includes other kaonic X-rays coming from the K− stopped inside the Kapton walls of the target cell, represented by Gaussian functions, with their transition energies set to the values used in [8], indicated with the dotted lines in the figure. A second-order polynomial function is used to represent the background over the fitted energy range (5 ÷ 10.5 keV). The resulting fit functions and the components corresponding to the kaonic helium-4 X-rays, are plotted in the energy spectra.
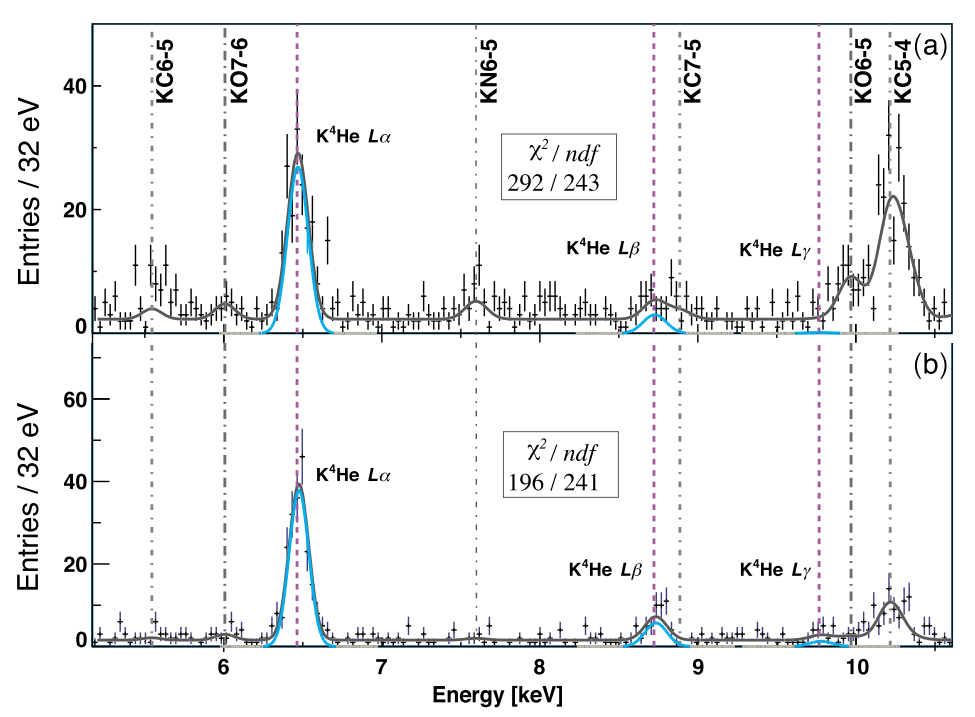
The Table below shows the absolute yields obtained from the SIDDHARTINO experiment through the fit of the spectrum above.
Dedicated Monte Carlo (MC) simulations, using GEANT4 toolkit, were performed to evaluate the fraction of kaons that needed to be stopped in the gas targets, to extract the absolute X-ray yields. The X-ray detection efficiencies of the SDDs, $\varepsilon^{MC}$, were extracted from the simulations. The errors coming from systematic uncertainties related to the setup material composition, beam features, beam pipe dimensions and densities were considered. More details on absolute yields extractions and MC simulations can be found in [1].
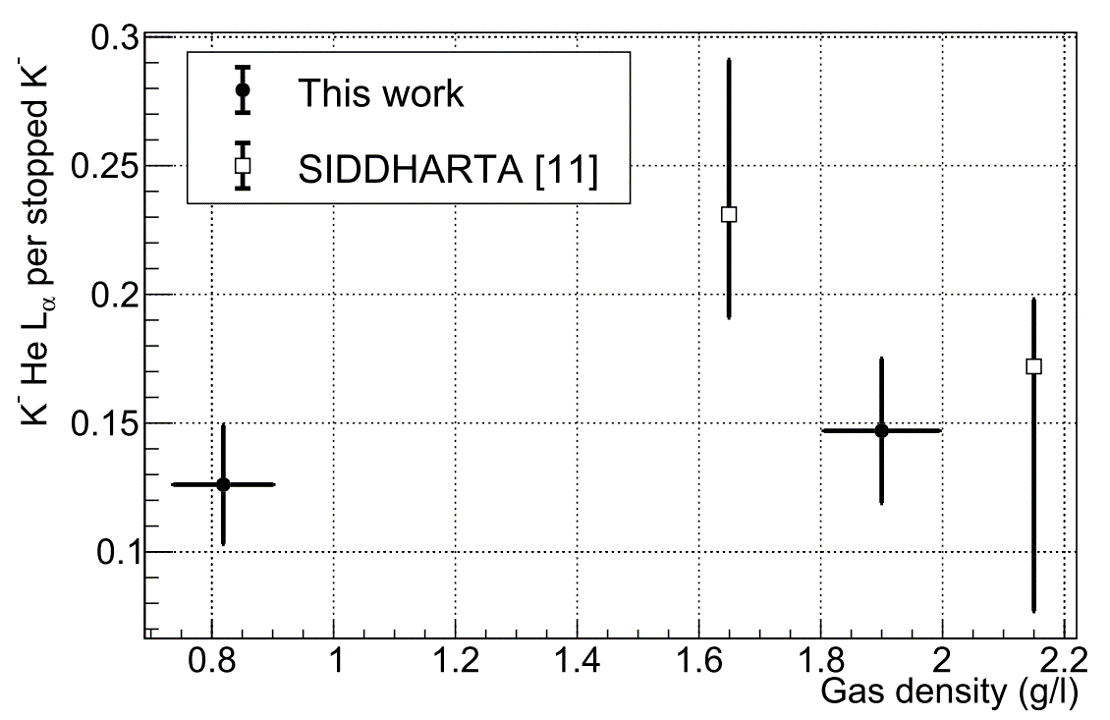
In the graph below, the absolute yields for the K––4He Lα X-rays measured by SIDDHARTINO and SIDDHARTA [9] experiments are plotted together. Both the measurement were performed in gaseous 4He.
References
-
-
[1]. D. L. Sirghi et al., A new kaonic helium measurement in gas by SIDDHARTINO at the DAΦNE collider, J. Phys. G: Nucl. Part. Phys. 49, 055106 (2022).
-
[2]. D. L. Sirghi et al. , A New measurements of kaonic helium-4 L-series X-rays yields in gas with the SIDDHARTINO setup, Nucl. Phys. A 1029, 122567 (2023).
-
[3]. L. De Paolis et al., Trigger rejection factor in the first kaonic helium run with the complete SIDDHARTA-2 setup, EPJ Web of Conferences 270, 00028 (2022).
-
[4]. M. Bazzi et al., Measurements of the strong-interaction widths of the kaonic 3He and 4He 2p levels, Phys. Lett. B 714, 40–3 (2012)
-
[5]. M. Miliucci et al., Silicon Drift Detectors’ Spectroscopic Response during the SIDDHARTA-2 Kaonic Helium Run at the DAΦNE Collider, Condens. Matter 6, 47 (2021).
-
[6]. S. Okada et al., Precision measurement of the x-ray energy in kaonic 4He, Phys. Lett. B 653, 387 (2007).
-
[7]. E. Friedman, A. Gal and C. J. Batty, Density-dependent K− nuclear optical potentials from kaonic atoms, Nucl. Phys. A 579, 518 (1994).
-
[8]. M. Bazzi et al., X-ray transition yields of low-z kaonic atoms produced in Kapton, Nucl. Phys. A 916, 30 (2013)
-
[9]. M. Bazzi et al., L-series X-ray yields of kaonic 3He and 4He atoms in gaseous targets, Eur. Phys. J. A 50, 91 (2014)
-