SIDDHARTA-2 — SDD calibration and stability
Silicon Drift Detectors (SDDs) are semiconductor detectors proposed for the first time in 1983 by Paul Rehak and Emanuele Gatti [1,2]. The SDD working principle is well explained in the SIDDHARTA-2 section of the website at this page. The SIDDHARTA-2 experiment equips 48 monolithic SDD arrays to measure x-ray transitions to the 2p energy level in gaseous kaonic 4He atoms. A monolithic SDDs array consists of eight square SDD cells (organized in 2 × 4 matrices), each with an active area of 8×8 mm2 and 450 µm thick silicon bulk. The SDDs are cooled down to a temperature of about 150 K. In these working conditions, the SDDs provide an efficiency of almost 100% for the x-ray detection in the energy between 5-12 keV, which corresponds to the region of interest for the kaonic deuterium measurement [3]. Each SDD was characterized before installation in the SIDDHARTA-2 setup. The laboratory tests show that the energy response of the SDDs is linear within 2-3 eV in the energy range between 4.5-12 keV and the energy resolution is 160 eV at 6.4 keV [4].
1. The calibration procedure
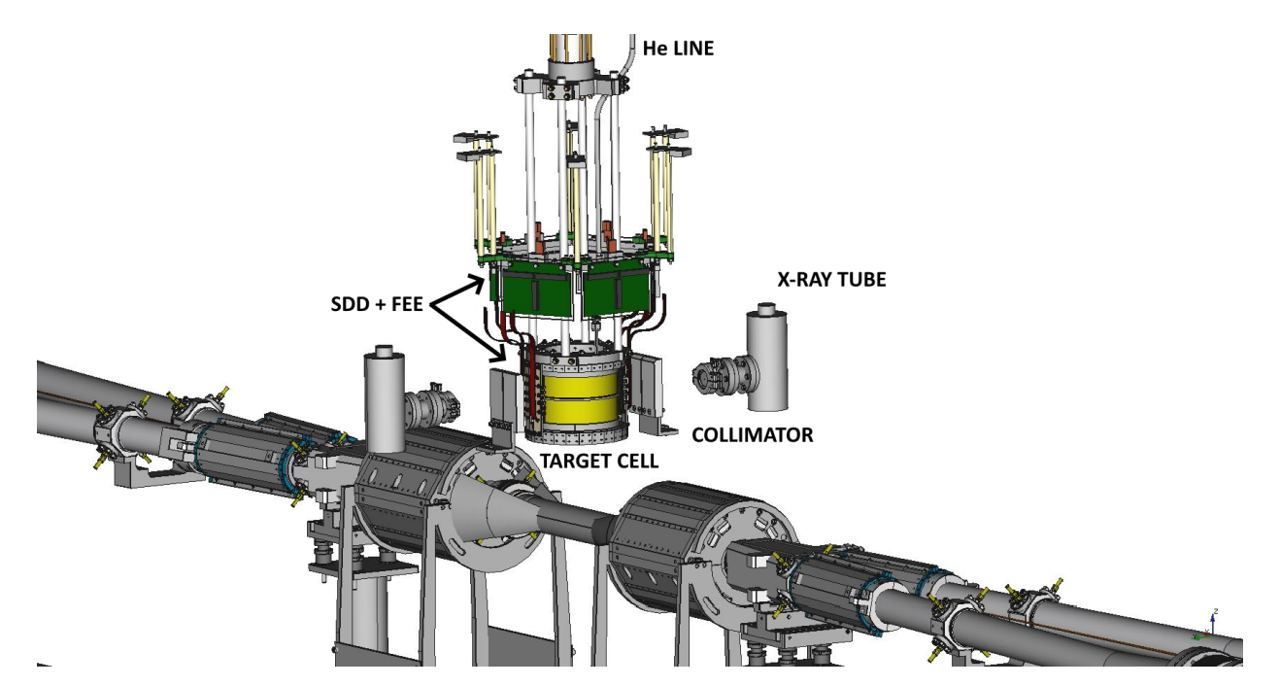
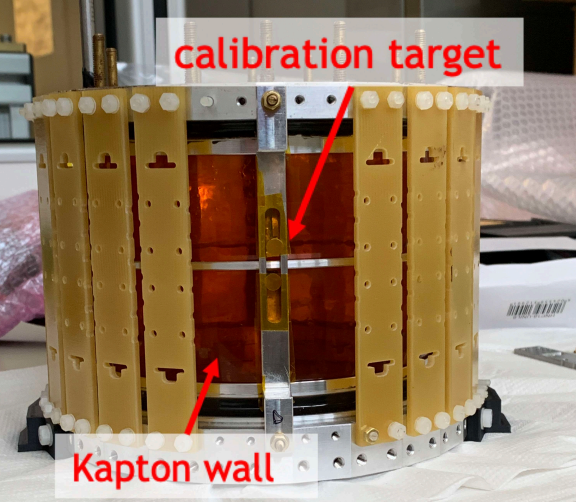
The calibration is a process that converts the digital counts acquired by the detectors into energy values. In linear detectors, it is sufficient to introduce fluorescences at known values, such as atomic transitions of tabulated known elements, to be used as a reference to construct a calibration line that converts the energy values from digital to analog. The energy calibration of the SDDs is performed using two x-ray tubes installed on two sides of the vacuum chamber, laterally to the beam line direction, emitting through multi-element high-purity titanium (Ti) and copper (Cu) strips placed on the target cell walls (see Figures below). The SDDs are placed around the cylindrical cryogenic target cell.
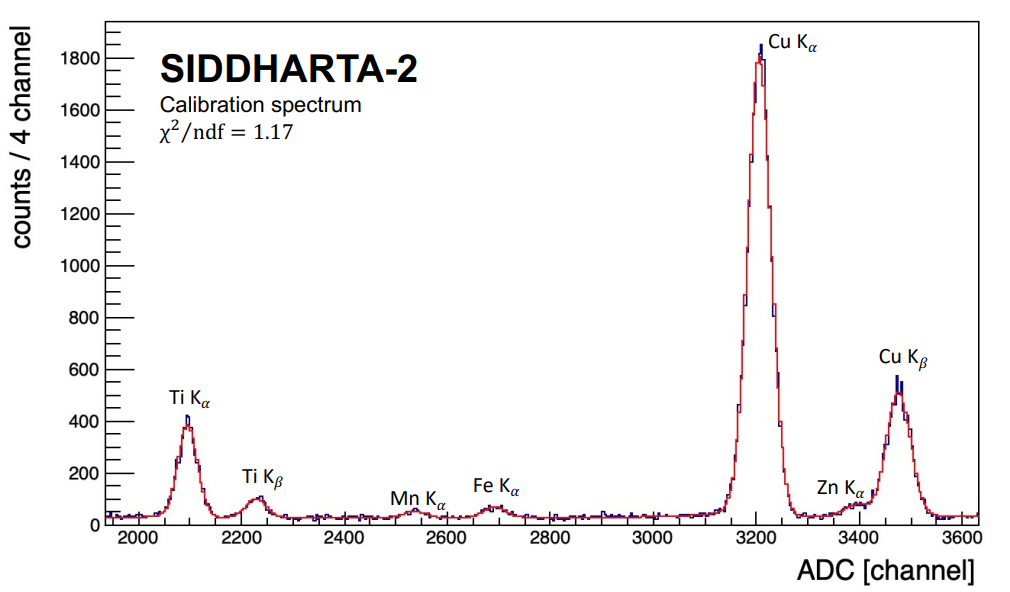
The typical calibration spectrum of an SDD is shown in the figure below. The Ti and Cu Kα and Kβ transitions are the x-ray fluorescences induced by x-ray tubes and used to perform a linear calibration. In the specific, only the Ti Kα and Cu Kα peaks are exploited for the calibration of the detectors, since they have the highest signal-to-background ratio. Manganese (Mn), iron (Fe) and zinc (Zn) Kα transitions are produced by the excitation of other components of the setup. Each Kα peak is the convolution of two transition lines, named Kα1 and Kα2. Once the calibration is performed, the x-ray tubes are switched off and the calibration lines are used during the SIDDHARTA-2 data taking to extrapolate the energy spectra.
The energy response function of the detector is predominantly a Gaussian curve for every fluorescence x-ray peak in between 5-12 keV; however, the response has a low energy component due to incomplete charge collection and electron-hole recombination. Therefore, in the spectral fit function, every peak is described with two contributions:
- Gauss function: the main contribution to the peak shape, shown below in (1). In the equation, $A_G$ is the gaussian amplitude and $E_0$ is the centre of the energy peak and $\sigma$ is the width, described as a function of the Fano Factor ($FF$), the electron-hole pair energy creation ($\varepsilon$) and the electronic and thermal noises ($noise$).
$G(E)=\dfrac{A_{G}}{\sqrt{2 \pi} \sigma} \cdot e^{\dfrac{-(E-E_0)^{2}}{2 \sigma ^{2}}}\quad , \quad \sigma = \sqrt{FF \cdot \varepsilon \cdot E + \dfrac{noise^{2}}{2.35^{2}}} \quad (1)$
- Tail function: an exponential function which reproduces the incomplete charge collection. The equation is shown below in (2). The constant $A_T$ is the amplitude of the tail function, the $\beta$ parameter is the tail’s slope, while $erfc$ is the complementary error function. The $\sigma$ and $E_0$ parameters are the ones already defined for the gaussian function.
$T(E)=\dfrac{A_T}{2\beta \sigma}\cdot e^{\dfrac{E-E_0}{\beta \sigma}\dfrac{1}{2\beta ^{2}}} \cdot erfc \left(\dfrac{E-E_0}{\sqrt{2}\pi}+\dfrac{1}{\sqrt{2}\beta} \right) \qquad \qquad \ \ \, (2)$
In the figure below, an enlargement of the previous spectrum in the Cu Kα and Kβ range is shown, with a reconstruction of the gaussian and tail curves used in the fit function.
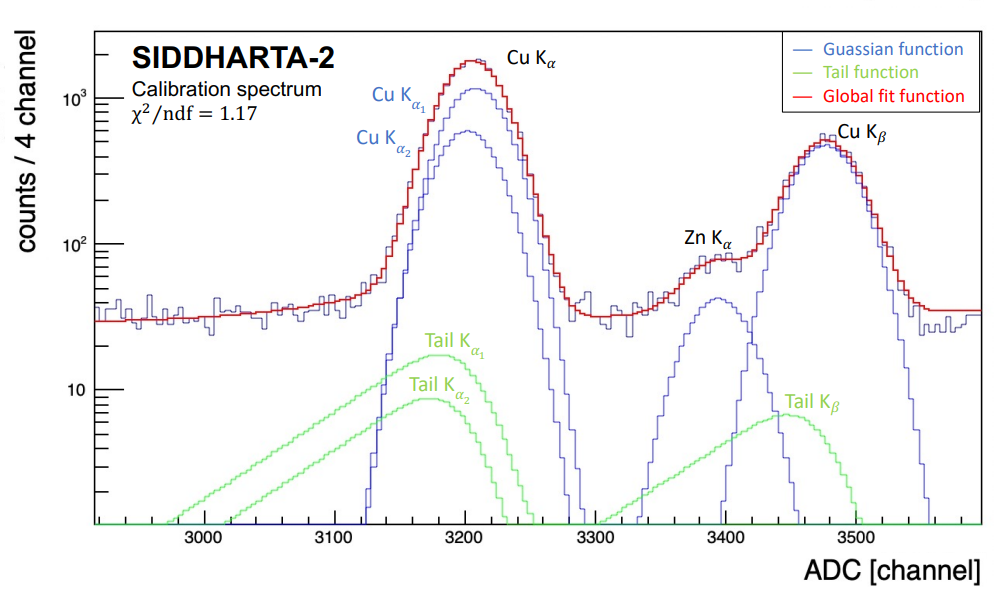
The calibration peaks were fitted using gaussian and tail functions for each component, to improve the calibration accuracy. Since the detector response is linear [5], the energy distance between the Kα1 and Kα2 was set to the reference value as well as the relative amplitude [6]. The Fe Kα peak, not included in the determination of calibration parameters, was used to evaluate the goodness of the calibration itself. After the sum of the calibrated spectra for all the SDDs, a fit was performed to obtain the energy position of the Fe Kα peak. The deviation of the Fe Kα with respect to the tabulated reference value [6] is 2 ± 0.1 eV, which characterizes the accuracy of the calibration method, as compatible with the linearity of the system.
2. Stability of the SDD detectors
The stability of the SDDs is crucial to perform high precision measurements because it reflects a possible source of systematic error for the SIDDHARTA-2 experiment. Moreover, a stable system needs fewer calibration runs during the kaonic atoms data taking and consequently will increase the experiment’s runtime. For these reasons, stability is a fundamental parameter that needs to be monitored carefully. During the first phase of the SIDDHARTINO experiment, which took place from June 2021 to July 2021, we monitored the stability of the SDDs for about one month and an integrated luminosity of 30 pb−1. During this period, 5 calibration runs were performed every ∼ 6 pb−1 of data taken. For each SDD, the calibration method was used to control the fluctuation over time of the Cu Kα peak position.
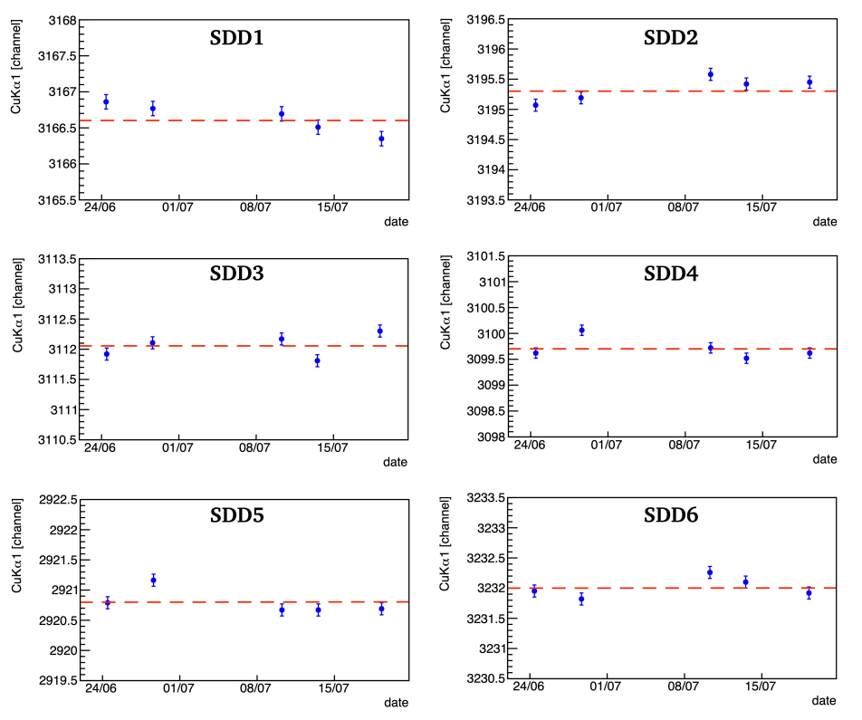
In the figure below, the position of Cu Kα, given in arbitrary units of ADC, for several SDDs is shown. The fluctuations of the Cu Kα position are about 0.5 channels, which corresponds to ∼ 1.5 eV.
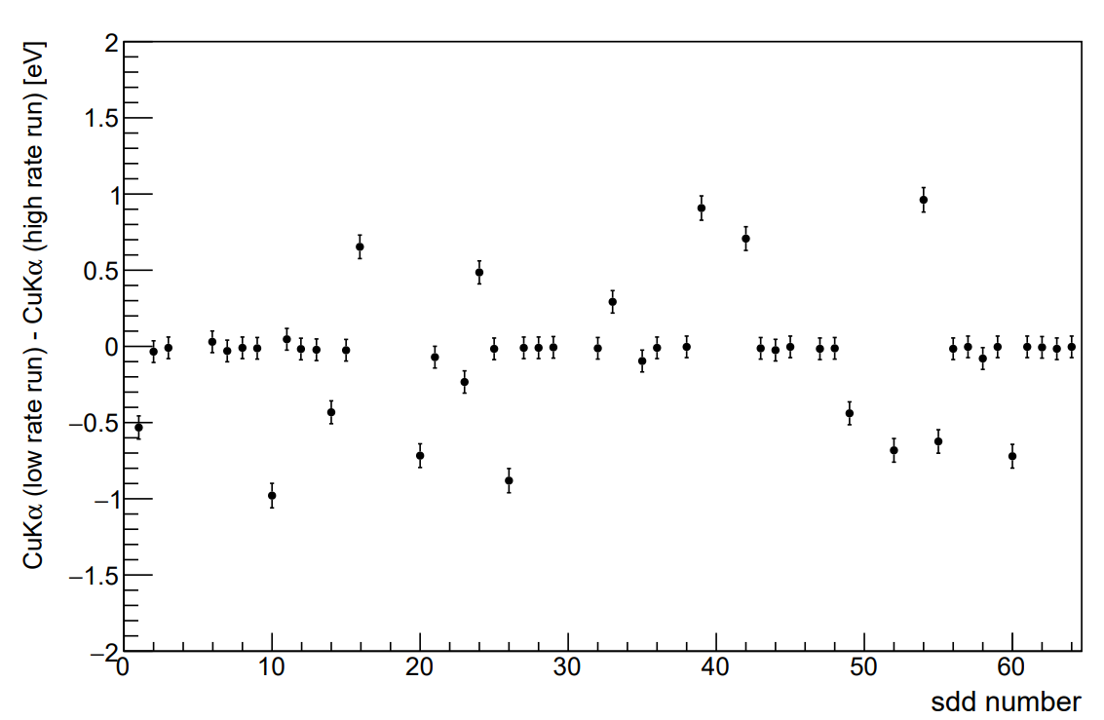
The stability of the SDDs’ energy response was tested with low and high counting rates, since during the beam injection the SDD rate can increase up to several hundreds of Hz, and then gradually decrease to a few tens of Hz. For this, two types of calibration runs were performed, varying the voltage and current parameters of the x-ray tubes in order to obtain two different counting rates (60 Hz and 600 Hz). The figure below shows the Cu Kα peak positions for high and low counting rates for several SDDs. For most detectors the difference is almost zero, for the others the fluctuation is compatible with the accuracy of the calibration. In conclusion, the energy response of the SDD system can be considered independent of the counting rate, within 1 eV.
 <
<
The results shown above proves the stability of the SIDDHARTA-2 SDDs detection system, presently installed in the DAΦNE collider, at National Laboratories of Frascati (INFN-LNF), in Italy.
References
-
-
[1]. E. Gatti and P. Rehak, Semiconductor drift chamber — An application of a novel charge transport scheme, Nucl. Instr. Meth. Phys. Res. 225, 608 (1984).
-
[2]. E. Gatti and P. Rehak, Semiconductor drift chambers for position and energy measurements, Nucl. Instr. Meth. Phys. Res. Sect. A 235, 224 (1985).
-
[3]. F. Sgaramella et al., The SIDDHARTA-2 calibration method for high precision kaonic atoms x-ray spectroscopy measurements, Physica Scripta 97, 11 (2022).
-
[4]. M. Miliucci et al., Energy Response of Silicon Drift Detectors for Kaonic Atom Precision Measurements, Condens. Matter 4, 31 (2019).
-
[5]. M. Miliucci et al., Silicon drift detectors system for high-precision light kaonic atoms spectroscopy, Meas. Sci. Technol. 32 095501 32, 095501 (2021).
-
[6]. H. Winick et al., X-Ray data booklet, Lawrence Berkeley National Laboratory (2009).
-